Developer Reference Overlays On Controls
Overlays and the ENCX .NET Controls
Drawing Overlays onto the Controls (C#)
To draw you own information on top of the chart drawn by the controls you can handle the PaintOverlays event. This event happens whenever the control has drawn some chart.
These code snippets assume a using EncXControls statement is present. First register to receive the event.
S57Control.PaintOverlaysEvent += new S57Control.PaintOverlays(OnPaintOverlays);And then you need a method that gets called...
private void OnPaintOverlays(object obj, Graphics g)
{
...
}
The object parameter is your S57Control object (you may only have one S57Control in your application and not need to cast this parameter). I hate been forced to cast to from object but I am a C++ programmer.
We are going to draw some lines on top of the chart and it will look horrible if they are not as nicely anti-aliased as the chart.
g.SmoothingMode = System.Drawing.Drawing2D.SmoothingMode.AntiAlias;First something really simple - overlaying some fixed information that is not tied to any geographic position on the Earth.
S57Control control = (S57Control)obj; // cast to get our control
Color red = Color.FromArgb(42, Color.Red); // red with alphablend of 42
Pen pen = new Pen(red, (float)100.0); // wide brush
g.DrawRectangle(pen, 0,0, control.Width, control.Height); // rectangle around the edge of the view
The GeoPix
GeoPix is an ENCX class that converts between geographic coordinates and pixel coordinates. Conversions are provided for points, lines and areas. It is important to use the correct conversion function.
If you have a long line it may appear curved in certain views. If you just converted the geographic position of the start and end and drew a straight line between them your straight line would not follow the correct path. Converting a geographic line into pixel space typically results in a list of points and a join-the-dots to get it drawn. GDI+ has drawing functions suited to this need.
Also due to the curvature of some lines, in some views you might need two lists of points as a line might start on the view, curve off the view and then curve back onto it later!
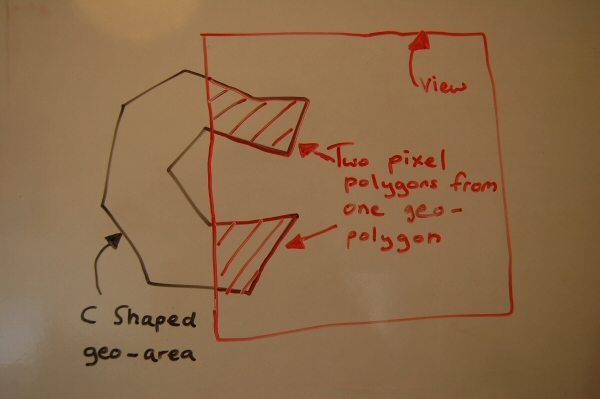
Representing geographic areas (polygons) has further pitfalls. For example a "C shaped" polygon in geographic space needs 2 polygons in pixel space to represent it if the view is to the right (east) of it and only the "ends" of the "C" are showing.
At Chersoft we have been developing navigation systems and other products that overlay information on charts for more than 17 years. We have hit these problems and solved them. Using the correct method from the GeoPix object for your S57Draw object is a huge step in the right direction.
Drawing Something at a Geographical Point
The simplest thing that people want to do is to plot a point on a chart. Like sticking a pin in a paper map. We use the Point method on the GeoPix for this. To test whether the geographical position is actually on the view we use the PointInView property which is true if the last call to Point was for a position on the view.
ENCX.GeoPoint point = new ENCX.GeoPoint();
point.Lat = 53.8;
point.Lon = -0.28;
ENCX.GeoPix geopix = m_draw.GeoPix;
ENCX.PixelPoint pixelPoint = geopix.Point(point);
if(geopix.PointInView) // this is true if the last Point conversion succeeded
{
    Brush choc = new SolidBrush(Color.FromArgb(64, Color.Chocolate));
    Brush dorc = new SolidBrush(Color.FromArgb(64, Color.DarkOrchid));
    Rectangle rect = new Rectangle((int)pixelPoint.X - 10, (int)pixelPoint.Y - 10, 21, 21);
    g.FillPie(choc, rect, 0, 90);
    g.FillPie(dorc, rect, 90, 90);
    g.FillPie(choc, rect, 180, 90);
    g.FillPie(dorc, rect, 270, 90);
}
The drawing code draws a quartered circle at one of the ends of the line that we will draw in the next bit of this article.
Drawing a Great Circle Line
// Create a great circle line...
ENCX.GeoPoint pointStart = new ENCX.GeoPoint();
pointStart.Lat = 53.8;
pointStart.Lon = -0.28;
ENCX.GeoPoint pointEnd = new ENCX.GeoPoint();
pointEnd.Lat = 53.7;
pointEnd.Lon = -0.11;
ENCX.GeoLine line = new ENCX.GeoLine();
line.LineType = ENCX.GeoLineType.GL_GreatCircle;
line.Point1 = pointStart;
line.Point2 = pointEnd;
// Convert in pixel space...
ENCX.GeoPix geopix = m_draw.GeoPix;
ENCX.PolyLines polyLines = geopix.Line(line);
// A nice orange pen...
Pen finePen = new Pen(Color.Orange, (float)2.0);
// Go through the resultant collection (of collections) of pixels
// and use the DrawLines method of the Graphics to get the line drawn
foreach(ENCX.PixelPoints pixelCollection in polyLines)
{
    if (pixelCollection.Count < 2)
       continue;
    PointF[] ptf = new PointF[pixelCollection.Count];
    int n = 0;
    foreach(ENCX.PixelPoint pixel in pixelCollection)
    {
        ptf[n++] = new PointF(pixel.X, pixel.Y);
    }
    g.DrawLines(finePen, ptf);
}
Drawing a Geographic Area
// Make a nice V shaped area...
ENCX.GeoArea area = new ENCX.GeoArea();
area.Points.AddLatLon(53.82, -0.27);
area.Points.AddLatLon(53.68, -0.2);
area.Points.AddLatLon(53.84, -0.12);
area.Points.AddLatLon(53.6, -0.2);
ENCX.IPolyAreas polyAreas = geopix.Area(area);
// Pen and brush in chersoft purple...
Pen thinPurple = new Pen(Color.Purple);
Brush purplishBrush = new SolidBrush(Color.FromArgb(64, Color.Purple));
// Fill and outline the resultant pixel space polygons...
foreach (ENCX.PixelPoints pixelCollection in polyAreas)
{
    if (pixelCollection.Count < 3)
        continue;
    PointF[] ptf = new PointF[pixelCollection.Count];
    int n = 0;
    foreach (ENCX.PixelPoint pixel in pixelCollection)
    {
        ptf[n++] = new PointF(pixel.X, pixel.Y);
    }
    g.FillPolygon(purplishBrush, ptf);
    g.DrawPolygon(thinPurple, ptf);
}
So here is the result (slightly mangled by JPEG encoding along the way - looks nicer really)...

See the EncViewWithCSharp sample that is installed with ENCX.